- Scrape specific fields of 20 tech companies stock information starting from January 1 2018 to most recent available data.
- Create a database to store those data scraped.
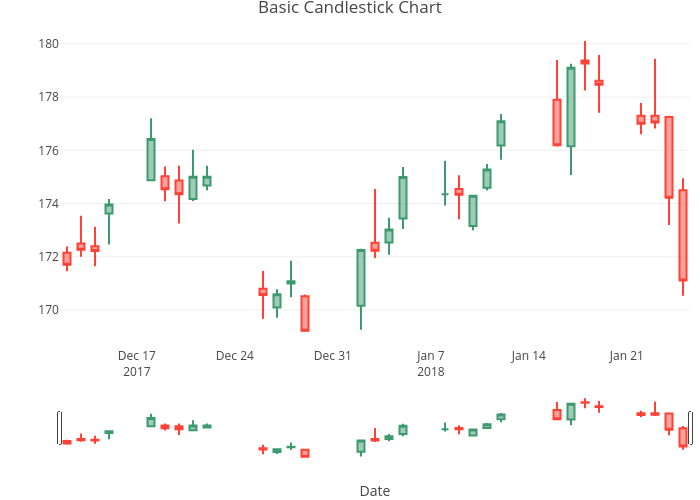
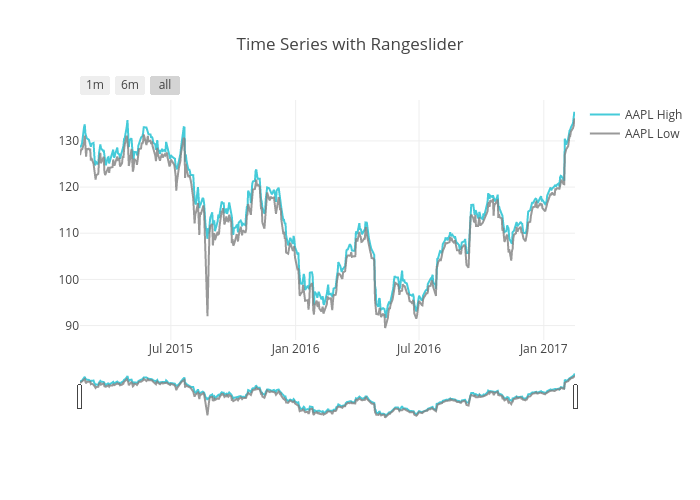
- Develop a web application to display stocks open, high, low, close price over time in 2 different charts and allow user to filter date range and sort by volume of day, month, or year.
- Extract data - iexfinance (Python library) https://pypi.org/project/iexfinance/
- Develop web application - Python/Django
- Display front-end interfaces - HTML, CSS, JavaScript/JQuery, plotly.js https://plot.ly/javascript/candlestick-charts/
- Manage database - SQL/MySQL
- Source code management tool - Git
- Apple Inc. (AAPL)
- Adobe Inc. (ADBE)
- Amazon.com, Inc. (AMZN)
- Baidu, Inc. (BIDU)
- Salesforce.com Inc (CRM)
- Cisco Systems, Inc. (CSCO)
- Dell Technologies Inc. (DVMT)
- Facebook Inc. (FB)
- Alphabet Inc. (GOOGL)
- Alphabet Inc. (GOOG)
- International Business Machines Corporation (IBM)
- Microsoft Corporation (MSFT)
- Netflix, Inc. (NFLX)
- Oracle Corporation (ORCL)
- Red Hat, Inc. (RHT)
- SAP SE (SAP)
- Square, Inc. (SQ)
- Tesla, Inc (TSLA)
- Twitter, Inc. (TWTR)
- Workday, Inc. (WDAY)
- Open Price
- Open Date
- Close Price
- Close Date
- High Price
- Low Price
- Volume
Source: https://plot.ly/javascript/candlestick-charts/
Source: https://plot.ly/javascript/time-series/
- Filter date range for each graph
- Sort stock by volume of day, month, or year

