Standard Ontology Visualization is a d3-based framework designed for visualizing Industry 4.0 Standards and their relations. The data used in this project is available at the Standard Ontology repository.
This project is live at https://i40-tools.github.io/StandardOntologyVisualization/
Alternatively, you can also downlaod the repository and open index.html using your browser.
Currently supported browsers:
- Google Chrome
- Mozilla Firefox
Please note you will need a working internet connection for the visualizations to load.
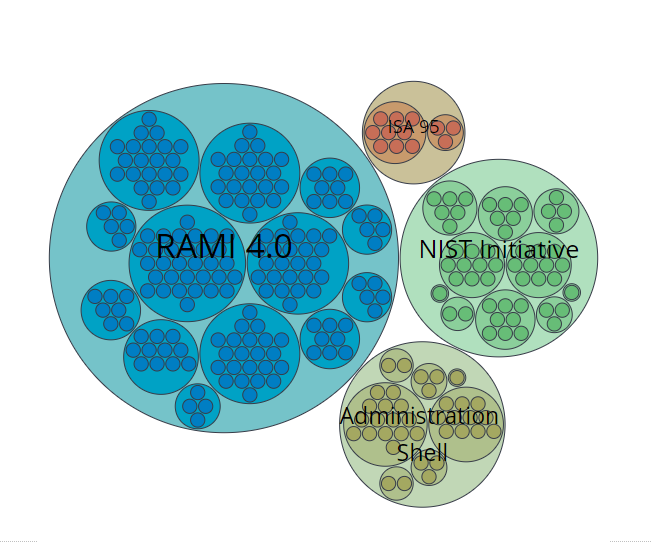
This chart represents the hierarchical relationship between Standards, the Classifications they fall under, and the Initiatives which define the classifications.
The largest circles represent initiatives. Circles contained within the biggest circle are the classifications defined by that initiative. Similarly the smallest circles represent the standards defined within a particular classification.
Clicking on any of the circles in the chart zooms in on the element and displays its details in the sidebar on the right. Users can use the search bar to search for any standards, classifications or initiatives. The breadcrumb trail on top of the chart also helps users navigate between elements.
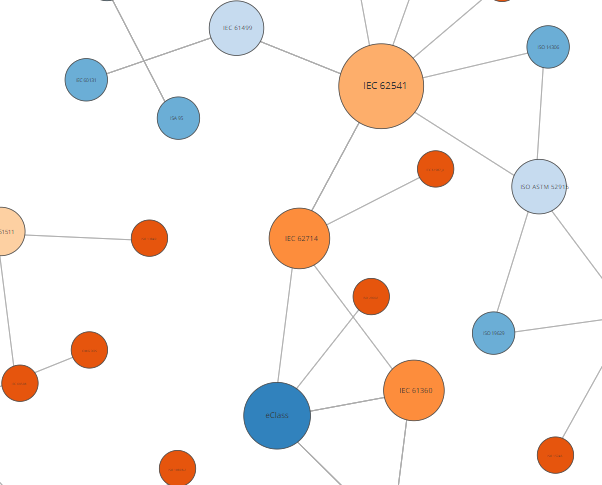
- Displaying Standards which have no relations in 'Network'
- Implementing semantic zoom over all views