

Data visualisation and ray tracing in Python based on NVIDIA OptiX framework.
- Sample images created with PlotOptiX: Behance, Instagram, and Facebook.
- Join Patreon for news, release plans and hi-res content.
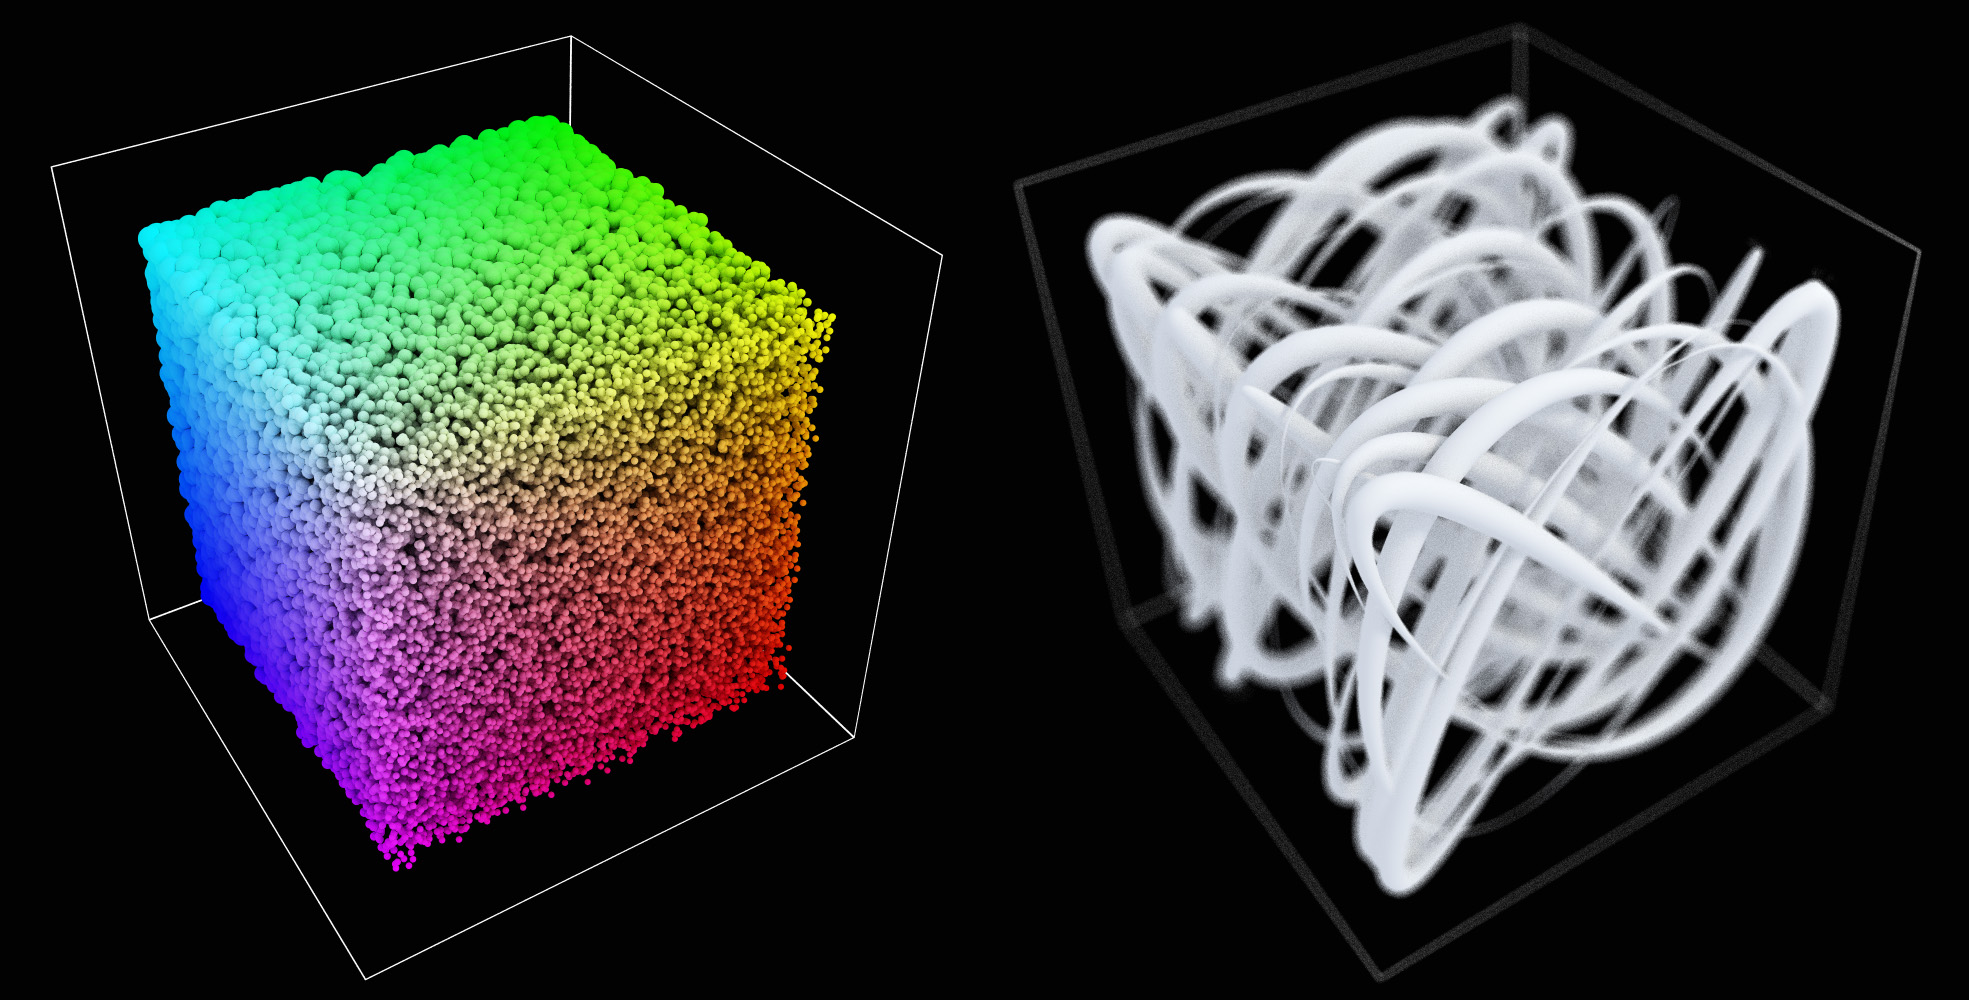
PlotOptiX is a 3D ray tracing package for Python, aimed at easy and aesthetic visualization of large datasets (and small as well). Data features can be represented in images as a position, size/thickness and color of primitives of several basic shapes, or projected onto surfaces of objects in form of a color textures and displacement maps. Triangular meshes, generated in the code or loaded from a file, are supported as well. All is finished with a photorealistic lighting, depth of field, and many other physically based effects simulated with a high quality.
No need to write shaders, intersection algorithms, handle 3D scene technicalities. Basic usage is even more simple than with matplotlib:
import numpy as np
from plotoptix import TkOptiX

n = 1000000                                  # 1M points, better not try this with matplotlib
xyz = 3 * (np.random.random((n, 3)) - 0.5)   # random 3D positions
r = 0.02 * np.random.random(n) + 0.002       # random radii

plot = TkOptiX()
plot.set_data("my plot", xyz, r=r)
plot.show()
... but PlotOptiX is much faster on large data, and, with all the raytraced shades and DoF, more readable and eye catching.
Check examples on GitHub for practical code samples and documentation pages for a complete API reference.
PlotOptiX is a set of CUDA shaders by R&D Team wrapped in C#/C++ libraries with a Python API. It is based on NVIDIA OptiX 7.7 framework and makes use of RTX-capable GPU's.
You can quickly display data in a simple plot:
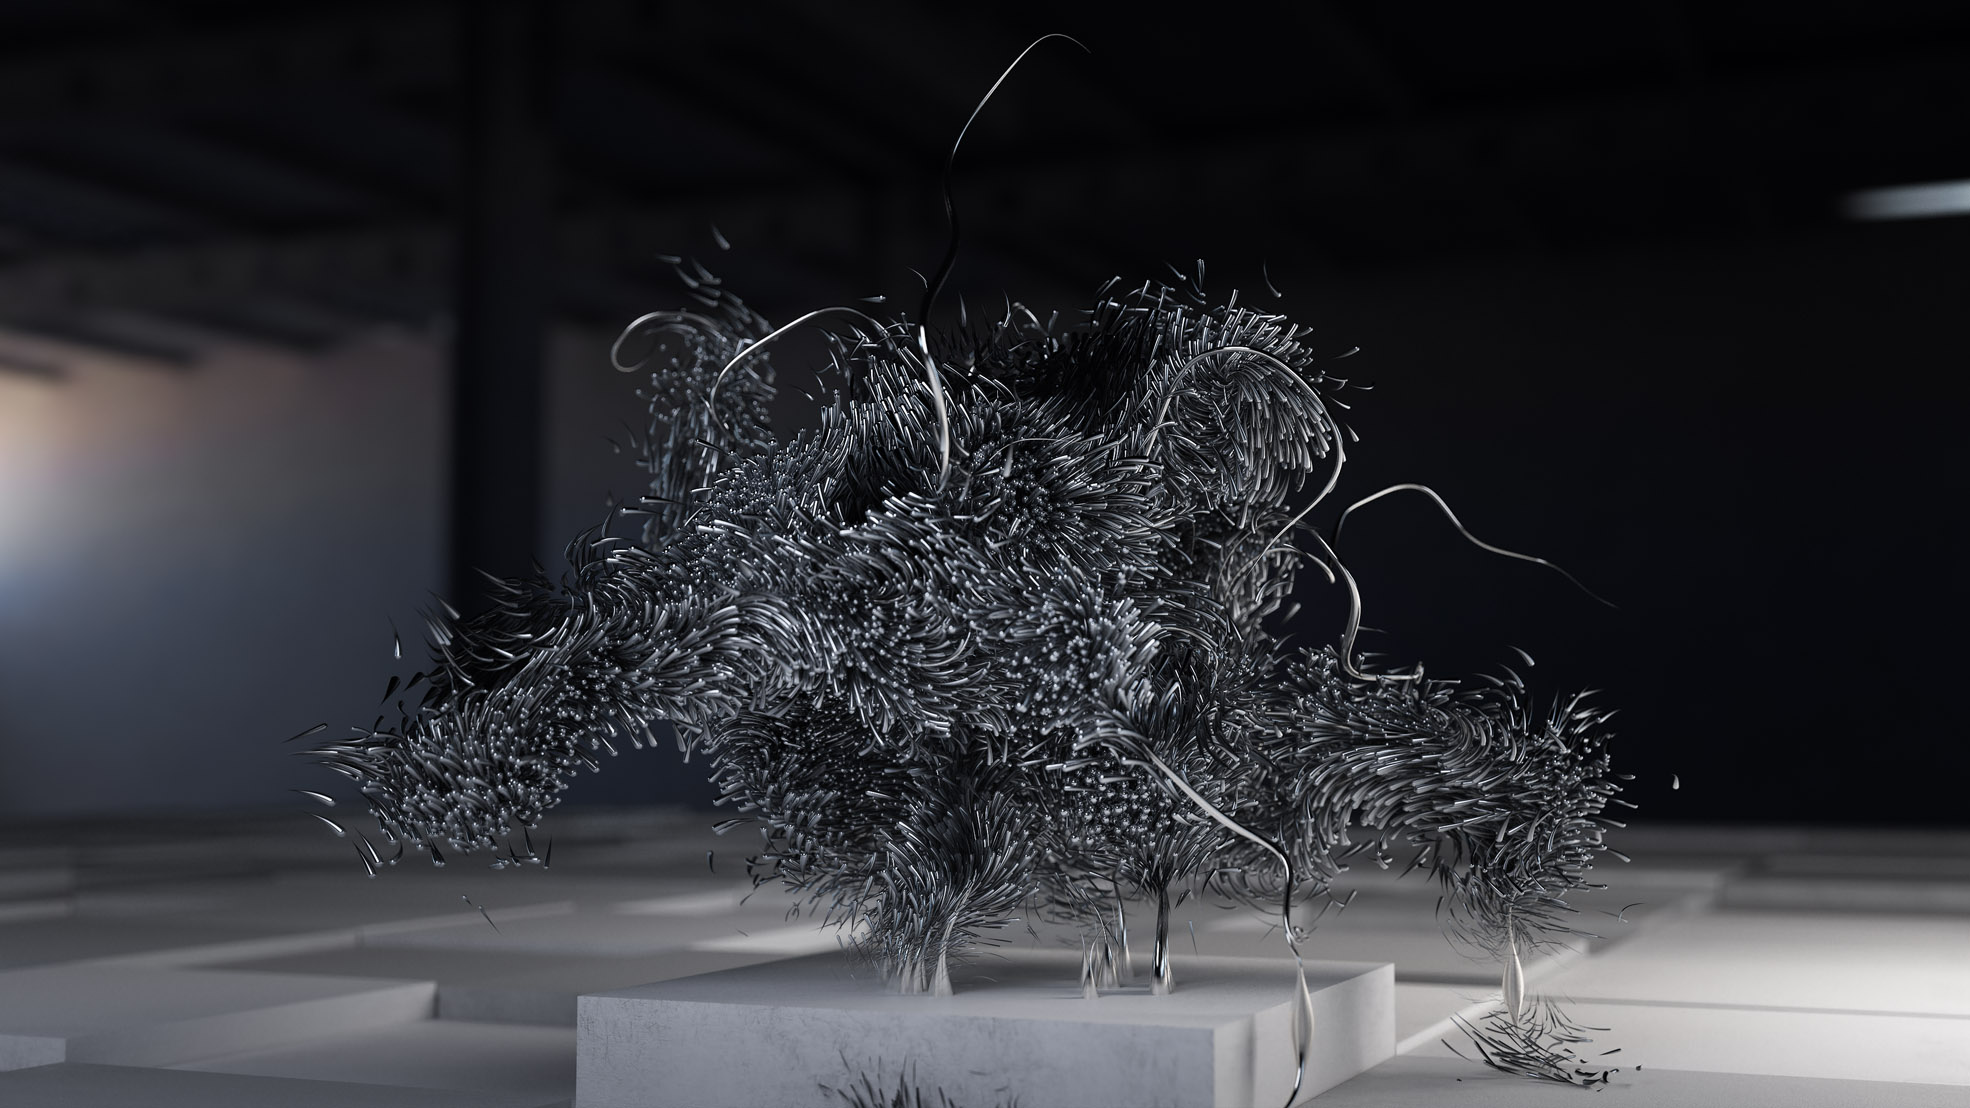
or prepare complex scenes, combining your generated data with meshes modeled elsewhere:
- progressive path tracing with explicit light sampling
- cameras: orthographic, pinhole, thin-lens and fisheye with depth of field and chromatic aberration simulation, panoramic camera for making 360 deg environment maps, user-defined projection for shooting rays at any angle, and from any origin
- geometries: particles (spheres), parallelepipeds, parallelograms, tetrahedrons, linear segments, bezier curves, b-splines; meshes: shaded surface or wireframe, automatically generated from a parametric surface or f(x,y) data, or defined with vertices and faces, e.g. created with pygmsh, or loaded from a file, e.g. supported by trimesh, or loaded from a Wavefront .obj file with a native loader
- materials: flat, diffuse, reflective, refractive; including: light dispersion, surface roughness and metalness, volume scattering, and nested volumes
- light sources: spherical and parallelogram, light emission in volumes, uniform environmental light or environment map
- post-processing: tonal correction curves, levels adjustment, apply mask/overlay, AI denoisers and upsampler (OptiX native and Intel Open Image models)
- callbacks: at the scene initialization, start and end of each frame raytracing, end of progressive accumulation
- 8/16/32bps(hdr) image output to numpy array, or save to popular image file formats
- zero-copy access to GPU buffers wrapped in ndarrays: 8/32bpc image, hit and object info, albedo, normals
- direct access to CuPy and PyTorch tensors data stored on GPU (and CPU as well) for texture and geometry updates
- GPU acceleration using RT Cores and everything else what comes with OptiX
- hardware accelerated video output to MP4 file format using NVENC 9.0
- Tkinter based simple GUI window or a headless raytracer
- configurable multi-GPU support
- a CUDA-enabled GPU with compute capability 5.0 (Maxwell) to latest (Ada Lovelace);
- NVIDIA driver >= r530;
- Python 3 64-bit
- Windows:
- Framework .NET >= 4.8 (present in all modern Windows)
- RnD.SharpOptiX and RnD.SharpEncoder libraries
- all other supporting 3'rd party libraries: FFmpeg (Windows only), LibTiff, Newtonsoft.Json
- Python examples
Note, at this point, PlotOptiX binaries are tested in: Windows 10/11 (any Python 3), and Linux (Python 3.8-3.10 recommended): Ubuntu 22.04, CentOS 7.
PlotOptiX was also successfully tested on the Google Cloud Platform, using Compute Engine instance with 2x V100 GPU's and Ubuntu 18.04 image. Here are the installation steps so you can save some precious seconds (FFmpeg not included).
If you'd like to work on Colab, it is possible as well. Here is a notebook with all the setup and a simple image generated with PlotOptiX. Note: Colab drivers usually are not up to date and the most recent PlotOptiX release may not be compatible with what Colab provides. The sample notebook is configured to install release wich works with the available driver.
Windows should be ready to go in most cases. You need to do some more typing in Linux.
.NET Framework:
You have it built in your Windows. Go ahead and install PlotOptiX.
Mono runtime:
Check if / which Mono release is present in your system:
mono -V

Mono JIT compiler version 5.18.1.3 (tarball Tue Apr  9 16:16:30 UTC 2019)
   Copyright (C) 2002-2014 Novell, Inc, Xamarin Inc and Contributors. www.mono-project.com
        TLS:           __thread
   ... (output cropped for clarity) ...
If mono command is not available, or the reported version is < 6.6, visit Mono download page and follow instructions related to your Linux distribution. You want to install mono-complete package.
pythonnet:
The pythonnet package is available from PyPI, however, you might need some prerequisities. Instuctions below are based on APT, replace apt with yum depending on your OS:
apt update
apt install clang libglib2.0-dev python-dev
You may also need to install development tools, if not already present in your system, e.g. in Ubuntu:
apt install build-essential
or in CentOS:
yum group install "Development Tools"
Then, update required packages and install pythonnet:
pip install -U setuptools wheel pycparser
pip install -U pythonnet
After successful installation you should be able to do python's import:
import clr
print(clr.__version__)
FFmpeg:
FFmpeg shared libraries >= 4.1 are required to enable video encoding features in PlotOptiX. Uninstall older version first. Visit FFmpeg site and download the most recent release sources. Unpack it to a new folder, cd to it. Configure, compile and install as below:
./configure --enable-shared
make
sudo make install
Add FFmpeg's shared library path to your config:
export LD_LIBRARY_PATH=$LD_LIBRARY_PATH:/usr/local/lib
sudo ldconfig
Using pip:
pip install -U plotoptix
From GitHub sources:
git clone https://github.com/rnd-team-dev/plotoptix.git
cd plotoptix
python setup.py install
Then, try running code from the top of this readme, or one of the examples. You may also need to install tkinter and/or PyQt packages, if not shipped with your Python environment.
This is still an experimental version in many aspects.
PlotOptiX is basically an interface to RnD.SharpOptiX library which we are developing and using in our Studio. RnD.SharpOptiX offers much more functionality than it is now available through PlotOptiX. We progressively add more to PlotOptiX based mostly on the interest of our patrons and applications that this project supports.
Download, star, and become our Patron if you like the project. Get in touch, share your use case, we are always happy to help and take part in exciting ideas of our users.
Looking at examples is the best way to get started and explore PlotOptiX features. Have a look at the readme and sample codes here.
Examples in the repository head may use features not yet available in the PyPI release. In order to download examples compatible with PyPI release install the package:
python -m plotoptix.install examples
This will create a folder with examples in the current directory.


